Update: 6th June 2022 Updated with the Season to date numbers for 2021/22
Update: 5th May 2022 Updated with the Season to date numbers for 2021/22
Update: 13th February 2022 Updated with the Season to date numbers for 2021/22
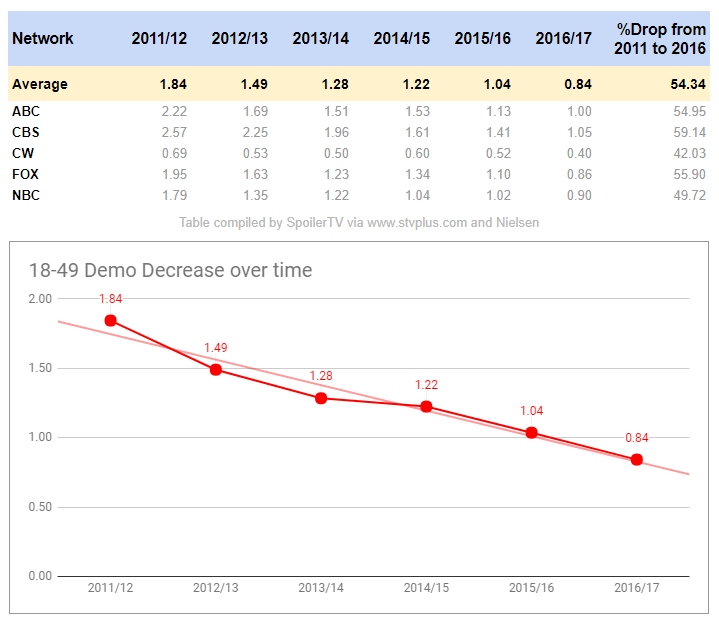
Here is the updated table. (Click to enlarge)
I often see lots of comments in our ratings threads about year to year decline and people banding about various numbers etc So I thought I’d take a look to see what these numbers actually look like.
For the last 6-7 years we’ve been keeping detailed ratings stats here at SpoilerTV in our Ratings Database. As a result we can take a look at some trends etc over the past years.
For the purposes of the results/chart below, be aware of the following.
– The Averages here are for the 18-49 Demo only
– The Averages here are for the main TV Season only
– We only include scripted Broadcast Primetime drama/comedies ie no reality/game show stuff/documentaries or other such bullshit.
So the table below for each of the past 6 years shows for each network the average 18-49 demo number for it’s shows.
The last column shows how much each network as a percentage has declined form it’s 2011/12 average through to last seasons average.
On the chart we’ve added a trend line
Thoughts/Comments
– As you can see there is a slow/steady decline year on year.
– Last season the ratings dropped from 10% to 20% depending on Network.
– The CW is the network with the smallest % decline
– CBS has the biggest % decline
– Last season was the first season ever that any other network other than the CW fell below 1.00
– We predict this season that all 5 networks will have an average of less that 1.00 for the first time ever.
Pretty depressing stuff if you’re a Broadcast Network Executive.


